
Introduction of AIOps Platform: The complexity of IT infrastructure is increasing more quickly than many organizations can adjust as 2025 draws near. IT teams are overwhelmed by alerts, data, false positives, overhead, and risk due to the proliferation of microservices, hybrid clouds, distributed systems, containers, and more telemetry than ever before. In this environment, identifying the top AIOps Platform for IT teams in 2025 is more about surviving than it is about trying out new technologies. AIOps is becoming a necessity rather than a “nice to have.”
The author of this guide has experience in IT operations, DevOps, and SRE roles and has seen firsthand how these tools change over time. I’ll explain what AIOps actually means today, why your team most likely needs it right now, and what features you should demand from a serious platform. After that, we’ll examine the top tools, including their strengths, weaknesses, and ideal team configurations. Lastly, I’ll provide you with a clear, word-based comparison, helpful guidance on selecting the best option, and an outlook on AIOps’ future.
Table of Contents
What Exactly Is AIOps Platform?
Artificial Intelligence for IT Operations is referred to as AIOps. The phrase encompasses a wide range of methods and tools, but the fundamental idea is that IT teams can more efficiently automate, identify, anticipate, and address operational problems by utilizing machine learning, analytics, big data, and occasionally generative artificial intelligence.
Here are the components in more detail:
- Telemetry ingestion: Think of logs, metrics, traces, events, topology, configuration changes. If you imagine a car, this is like having sensors on the engine, brakes, speedometer, oil temperature, etc. AIOps platforms collect data from many such “sensors.”
- Baseline and anomaly detection: The system learns what “normal” looks like (e.g. CPU usage, latency, error rates) and can detect deviations. It’s like noticing that your car is slightly vibrating more than before and warning you before something breaks.
- Alert/event correlation and noise reduction: Many alerts are related or redundant; many are false positives. AIOps tries to group related ones, suppress duplicates, filter out noise so you only get to see what matters.
- Incident management & root cause analysis: Once an issue arises, AIOps helps suggest possible causes or dependency paths, show you what changed recently (deployments, configuration), where the failure might be.
- Predictive insights / forecast: It might warn you that disk usage will hit capacity in two hours, or that a service’s latency is gradually creeping up. This gives you time to act.
- Automated response and remediation: Some platforms allow you to configure automated actions
- restarting services, scaling up, rolling back deployments either fully automatically (with safeguards) or semi-automatically triggered by humans.
Real-world illustration: Let’s say a payment microservice on an e-commerce site experiences a gradual rise in latency following a deployment. You will have to spend hours tracking down the numerous timeouts, errors, and high CPU that traditional monitoring tools may flag. An AIOps platform may detect the increase sooner, link it to the deployment, recommend a rollback or resource scaling, alert the appropriate parties, and potentially initiate a rollback or spin-up additional instances. Hours of downtime and customer annoyance are avoided.
Why IT Teams Need AIOps Platform in 2025
Let me share some pain points that teams are saying again and again, and how AIOps addresses them. If any of these sound familiar, you’re already a candidate for adopting or upgrading your AIOps solution.
- Too many alerts, too many tools
Many organizations have monitoring tools for infra, logs, app performance, service health, synthetic traffic, etc. Each comes with its own alerting. Engineers spend a lot of time switching between dashboards, trying to figure out which alert is relevant. AIOps platforms aim to unify or at least integrate, reducing context switches, and reduce “alert fatigue” by suppressing or correlating redundant alerts. - Slow detection and long MTTR
If something goes wrong, often detection happens after users complain, then engineers have to piece together logs, metrics, traces, change history. That takes time. By predicting anomalies, shortening the detection window, and offering root cause analysis, AIOps reduces mean time to detection (MTTD) and mean time to resolution (MTTR). - Scaling complexity
When you add more microservices, more cloud infra, more regions, more containers, everything becomes more dynamic. Infrastructure that changes constantly requires tools that adapt, auto-discover dependencies, auto-map services, understand orchestration systems, etc. - Manual toil, burnout, cost
Repetitive tasks (like alert triage, incident routing, basic diagnosis) are time-consuming and error-prone. AIOps can automate much of that. That gives engineers time to work on innovation, improvement, prevention rather than constant firefighting. - Risk of business impact and compliance issues
Downtime, performance degradation, outages aren’t just IT problems. They cost revenue, customer trust, sometimes regulatory penalties. Observability, proactive maintenance, root cause traceability, responsive incident management are all part of risk mitigation.
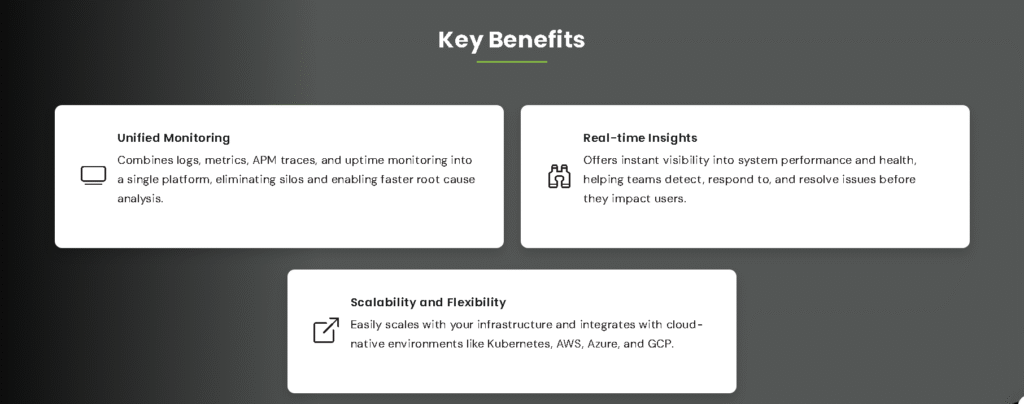
Core Features You Should Expect in a Great AIOps Platform
Before we look at tools, here are the features you should demand. I list these from “must-have” to “nice-to-have,” in a way that reflects what real teams need.
- Unified telemetry ingestion: Logs + metrics + traces + events + topology + deployment/CI changes + config/state changes. If your tool only does logs or metrics, you’ll eventually hit gaps.
- Real-time monitoring & observability: Golden signals (latency, error rate, throughput), service maps, dependency graphs, synthetic/user experience monitoring, dashboards that reflect current state, not yesterday’s.
- Anomaly detection + predictive analytics: Identification of anomalies without manual thresholds; forecasting resource usage; identifying slow drifts; alerting before things get bad.
- Incident/event correlation + noise reduction: Grouping related alerts, suppressing duplicates, reducing false positives. If your team spends more time chasing noise than real incidents, you’ll know you need this.
- Root cause analysis (RCA): The ability to quickly see probable root causes, including recent deployments/configuration changes, dependencies, trace context.
- Automated incident response / workflows: Not necessarily fully autonomous (depends on risk), but capability to trigger defined responses, escalations, runbooks, even rollback or scaling, perhaps with manual approval.
- Alert management & workflows: On-call schedule, escalation policies, integration with communication tools (Slack, Teams, PagerDuty etc.), routing, collaboration features.
- Incident management & case tracking: Being able to open, track, document incidents (cases), track SLO/SLI thresholds, have post-mortems, audit trails, business impact.
- Security, compliance, governance: Data protection, access control, audit logs, ensuring retention, possibly integration with security monitoring or SIEM capabilities.
- Scalability & flexibility: Handling many hosts / containers / regions; supporting multi-cloud, hybrid; flexible deployment if needed; ability to scale up volumes of data and burst loads.
- Usability & cost transparency: Clean, intuitive user interfaces; minimal overhead to maintain; transparent cost models (ingest, retention, feature tiers), ability to try before buying.
- Integration ecosystem and vendor support: Integrations with alerting, monitoring, deployment systems, ticketing, collaborating tools. Support and roadmap matter tools that stagnate are risky.
Best AIOps Platforms for IT Team in 2025
Here are six of the major platforms (often mentioned in industry reports) with deeper human explanation: what they do, what’s strong, where you might struggle, and what kinds of teams they’d suit.
1. Dynatrace
What it is / Key capabilities:
- Dynatrace is a unified observability and AI-powered platform that excels at automatically discovering infrastructure, mapping dependencies, and monitoring full stack performance from microservices and containers to applications and user experience.
- It uses its proprietary AI engine (“Davis”) for anomaly detection, root cause analysis, predictive analytics, and lately even more automation and generative AI features.
- Auto-discovery: when your environment changes (new service, host, container), it maps that without manual configuration.
Strengths:
- Very strong in real-time monitoring and observability; its topology/dependency mapping is among the best. If you’re dealing with dynamic microservices or large cloud environments, this matters a lot.
- Excellent root cause analysis: because Davis can combine many signals (metrics, traces, logs, event changes) and infer causality rather than just correlation.
- Predictive features and strong alert noise suppression.
Challenges:
- Can be relatively expensive. For smaller teams or lower budgets, the cost of ingest, hosts, tracing, storage, etc., can add up.
- Learning curve: to get the most out of it (fine-tuning alerts, understanding causes, optimizing dashboards) there is setup / tuning overhead.
- Sometimes overkill if you have fewer services, static infrastructure, or simpler observability needs.
Best fit team / use-case:
- Large enterprises with cloud or hybrid cloud infrastructures, many microservices, many hosts, dynamic scaling.
- Teams investing in observability, who want predictive IT maintenance and want to reduce downtime and MTTR aggressively.
- Organizations where performance and user experience are critical, and failures are costly.
2. BigPanda
What it is / Key capabilities:
- BigPanda focuses especially on event correlation, incident analysis, and alert consolidation. It’s often used as a layer on top of existing monitoring tools.
- It unifies fragmented data (alerts/events from many sources), applies machine learning to filter noise, finds probable root causes, provides insights and dashboards. It also helps with automations around incident response workflows.
Strengths:
- Does very well reducing alert noise turning many alerts from many tools into fewer actionable incidents. That immediately helps teams that are overwhelmed by incoming alerts.
- Integration capability: because many organizations already have monitoring tools; BigPanda is good at stitching them together.
- Good for incident management AI: naming summaries, suggesting causes, giving context.
Challenges:
- It’s not always as strong in full observability (traces, logs, metrics) as a tool designed from scratch for that. So if you want one tool to do everything (APM, infra monitoring, tracing, UX), you might still need to combine others.
- Automated actions / remediation are possible but may require a lot of custom logic / configuration.
- Pricing and scale depend heavily on how many events/alerts you process and how many integrations; if you have huge volumes, cost can grow.
Best fit team / use-case:
- Teams with existing monitoring stack who want to tame alert fatigue and accelerate incident response.
- Organizations with several monitoring tools and want a unifying layer.
- SRE/DevOps teams aiming to reduce MTTR first, before investing heavily in full stack observability.
3. PagerDuty
What it is / Key capabilities:
- PagerDuty is known for incident response lifecycle: routing alerts, escalation, on-call management, automated workflows. It also includes ML/AI for event correlation and helps automate the response process.
- It doesn’t always do all monitoring features itself; rather, it integrates with monitoring/observability tools to manage the incident side.
Strengths:
- Very strong around incident workflows: integrating on-call, escalation, alerts, notifications. If something triggers, PagerDuty is built to ensure the right people get notified, escalations happen, etc.
- Good customization of workflows; triggering different responses depending on severity, team, etc.
- Very mature product; good support, integrations.
Challenges:
- For monitoring/observability (metrics/traces/logs), you’ll usually need other tools; PagerDuty isn’t meant to replace full observability it complements.
- Costs can escalate with number of users, alert volumes, advanced features.
- Depending on how much automation you want, there is work required to set up routing, response actions, runbooks, etc.
Best fit team / use-case:
- Teams that need a strong incident management layer, especially if they already have other tools for monitoring/observability.
- Organizations where on-call, escalations, response time are under pressure.
- DevOps / SRE teams who need reliable, predictable alert and incident workflow orchestration.
4. New Relic (Applied Intelligence + Observability)
What it is / Key capabilities:
- New Relic combines observability (APM, infrastructure, logs, metrics, traces, synthetic monitoring) with AI/ML features under “Applied Intelligence.”
- It has features like predictive alerts, automatic anomaly detection, alert correlation, causal analysis, and integrations with incident management tools.
Strengths:
- Very good at reducing alert noise, especially with correlation across tools/events. It allows you to see upstream/downstream dependencies easily, see which services are affected, etc.
- The transparency of correlation logic, so you can see why the tool grouped certain alerts, which builds trust.
- Useful features to help detect alert coverage gaps: places in your stack where you’re not monitoring enough or missing important signals. So, not just reacting, but helping you build better monitoring hygiene.
Challenges:
- When data volumes are huge, costs of ingestion, storage, etc., can add up.
- Some features (like root cause tracing, especially in very distributed environments) may require careful instrumentation, configuration, and sometimes work to tune.
- For teams new to observability tools or with simpler needs, there may be parts of this toolset more than you immediately need; deciding which parts to turn on matters for cost and efficiency.
Best fit team / use-case:
- Teams who want one platform to do both observability + incident management / AI insights, rather than stitching several tools.
- Organizations that want to improve MTTR, reduce alert fatigue, and detect issues proactively.
- Teams scaling up, wanting better insights, building up mature monitoring practices.
5. Elastic Observability
What it is / Key capabilities:
- Elastic (Elasticsearch + Beats + APM + Observability features) offers unified ingestion of logs, metrics, and traces. It has features for synthetic monitoring, alerting, incident management (cases), and behavior- or anomaly-based detection.
- It builds “Cases” which are workspaces / incident records where you can centralize relevant telemetry, links, logs, traces, metadata, and collaboration.
Strengths:
- Good flexibility, especially for teams comfortable with more configuration. Because Elastic is more open, you get control over retention, what you monitor, schema, data model.
- Strong in alerting, in behavior-based detection, and integration with external incident management tools.
- Often more cost-efficient in certain data volumes, especially if you manage or self-host or fine-tune retention/storage.
Challenges:
- For teams without experience, the setup / tuning of Elastic (schema, ingestion, agents, instrumenting APM/traces) takes effort. Default configurations may not capture everything.
- When scaling massively, and needing high retention of logs/traces, storage and query performance can get expensive / complex.
- The “one-size-fits-everything” observability experience might feel less polished compared to some SaaS-native tools; dashboarding and UX sometimes require more manual effort.
Best fit team / use-case:
- Organizations comfortable with more control and customization, maybe with self-hosted infrastructure, or wanting to avoid lock-in.
- Teams tackling observability, wanting input across logs, metrics, traces with incident management integrated.
- Cases where cost control and fine-tuned configuration are important, or where you want to run parts of the stack in-house.
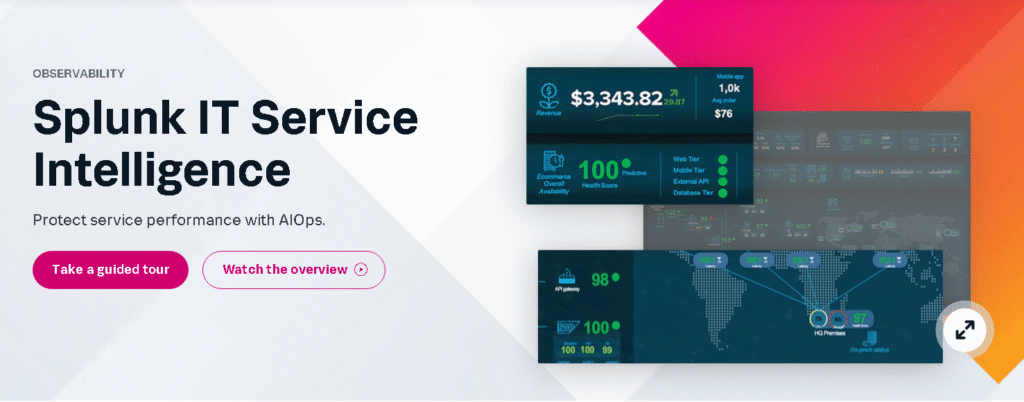
6. Splunk + Splunk IT Service Intelligence (ITSI)
What it is / Key capabilities:
- Splunk has long been known for log management, search, and security analytics. With its IT Service Intelligence (ITSI) or Observability modules, it adds more AIOps-style capabilities: service health dashboards, KPI monitoring, anomaly detection, predictive analytics, event / alert correlation, and dependency/service impact mapping.
- It also offers strength in handling large data volumes, combining security and operational data, auditability, etc.
Strengths:
- Very strong in environments with high volumes of log data, or where security/compliance is important, or where you already use Splunk and want to extend into observability/AIOps.
- Good search/query performance, capacity to integrate many data sources, flexible dashboards and visualizations.
- If you want both security monitoring and IT operations monitoring in same or overlapping systems, Splunk is often attractive.
Challenges:
- Cost: ingesting many logs, retaining them for long periods, querying across them, correlating with metrics and traces can become expensive.
- Complexity: setting up service maps, adding tracing, tuning alerts, defining appropriate thresholds can take time and people.
- For smaller or mid-size teams, maybe overkill if you only need a subset of features.
Best fit team / use-case:
- Medium to large enterprises, especially ones that need both security and operations observability, or that already have Splunk for logs or SIEM.
- Teams who care about audit trails, compliance, performance, and want an all-round platform.
Quick Comparison of AIOps Platforms (2025)
| Platform | Feature Focus | Pricing* | Best For |
|---|---|---|---|
| Dynatrace | Full-stack observability + strong AI root cause analysis | $$$ (premium, usage-based) | Large enterprises, complex hybrid/microservice environments |
| BigPanda | Alert/event correlation, noise reduction | $$ (event volume-based) | Teams with many monitoring tools, alert fatigue issues |
| PagerDuty | Incident response, on-call & escalation workflows | $$ (per user, feature tiered) | Teams needing reliable incident management layer |
| New Relic | Unified observability + AI insights (Applied Intelligence) | $$ (usage-based, transparent tiers) | Small to large teams wanting all-in-one observability |
| Elastic | Logs + metrics + traces + Cases, flexible & open | $–$$ (infra/storage-based; can self-host) | Teams with technical skills wanting customization & cost control |
| Splunk (ITSI) | Log analytics + service intelligence + compliance | $$$ (high data ingest cost) | Enterprises already using Splunk, regulated industries |
Pricing: $ = budget-friendly, $$ = mid-range, $$$ = premium/enterprise.
How to Choose the Right AIOps Platform (Human Tips)
Here’s your section tightened to under 258 words while keeping it natural and practical:
Start with your pain points
Ask: what keeps your team up at night? Too many alerts, long MTTR, surprise outages, or poor visibility? Pick one or two key problems and evaluate tools by how well they solve those first.
Estimate current and future telemetry needs
Know how many hosts, services, and containers you run today, and project six to twelve months ahead. Data ingestion (logs, traces, metrics) will directly impact both architecture and cost.
Consider usability
If your engineers enjoy customization, Elastic or other configurable tools may work. If you need quick value, look for out-of-the-box ease. Factor in who will use it on-call engineers, SREs, ops staff.
Run a PoC with real data
Feed in production-like logs, metrics, and alerts. Measure noise reduction, root cause accuracy, and changes in MTTD/MTTR.
Check integrations
A good platform plugs into your ticketing, CI/CD, chatops, and cloud stack. Extra overhead kills value.
Understand pricing models
Licenses are just the start. Costs rise with ingestion, retention, trace sampling, and support tiers.
Plan for human effort
Dashboards, anomaly tuning, agent upkeep make sure the tool won’t overwhelm your team.
Governance and compliance
Audit logs, encryption, access control, SLA/SLO tracking matter, especially in regulated industries.
Vendor roadmap
Is the vendor innovating adding ML, generative AI, automation? Responsive to feedback? A stagnant tool will become a burden.
Future Trends in AIOps Platform
As of mid-2025, I see several trends that are already shifting where AIOps is going, and what new platforms will offer. These are things to watch, because you want a tool that will age well.
- Generative AI for operations: Using LLMs or agents to generate incident summaries, suggest fixes in natural language, assist in writing runbooks, even create automation scripts. This reduces friction.
- Autonomous / closed-loop remediations: Not just alert and suggest, but in safe circumstances, tools automatically remediate issues (spin up resources, restart services, failover), possibly with human approval paths.
- Explainability & trust: As systems automate more, users want clear reasons: why did the tool flag something? Which signals led to root cause? This helps with trust and making sure people don’t ignore AI.
- Edge and distributed observability: More operations at the edge (IoT, remote, disconnected infrastructure) will demand tools that can work with limited connectivity, intermittent data, and decentralized architecture.
- Observability + security convergence: Combining AIOps with SIEM, threat detection, compliance, data protection features. Many platforms are already pushing this direction.
- Better cost optimization and observability hygiene: As data volumes explode, tools and practices that help detect “gaps” in monitoring, reduce redundant signals, efficiently store telemetry, choose sampling rates, etc., will be more important.
- Real-time / streaming analytics: Reducing lag between event generation and detection, pushing toward near-instant insights.
Final Thoughts / Conclusion
If I were advising an IT team in 2025 who is considering adopting (or replacing) an AIOps platform, here’s what I’d say:
- Pick a platform that matches your biggest pain point first. If it’s alert fatigue, prioritize tools with strong correlation and noise reduction. If it’s slow root cause, pick ones good at observability + tracing + dependency mapping.
- Don’t let shiny feature lists distract your usability, integration, cost, and human overhead often make or break success.
- Start with a pilot. Use your real data, with your services, under your load. Measure before and after, especially MTTD, MTTR, number of alerts per person per week, etc.
- Plan for scale: both technical scale (hosts, traces, etc.) and organizational scale (more teams, more services). A tool that works well for a small dev team may struggle when dozens of microservices are added.
- Ensure your team is ready: you’ll need instrumentation, monitoring rules, dashboards; someone (or more) who understands observability, who can tune the system, review alerts, refine thresholds. AI can assist but it doesn’t eliminate work.
- Keep one eye on the future: ensure vendor is active, innovating, improving, not stagnant. Features like generative AI, closed-loop automation, and AI transparency matter going forward.
At tooljunction, we share honest AI tool reviews and tutorials to help you choose the right tools for your business.
FAQ
1. What is an AIOps platform and why do IT teams need it?
An AIOps platform uses artificial intelligence and machine learning to automate IT operations. IT teams need it to cut through alert noise, detect anomalies faster, reduce downtime, and manage increasingly complex environments like hybrid cloud and microservices.
2. How does AIOps improve incident management for IT teams?
AIOps enhances incident management by automating root cause analysis, correlating alerts across systems, and enabling faster response. Instead of drowning in false positives, IT teams get prioritized, actionable insights that shorten mean time to detect (MTTD) and mean time to resolve (MTTR).
3. What features should I look for in the best AIOps platform for 2025?
Key features include anomaly detection, predictive IT maintenance, automated incident response, AI-powered observability, strong integrations, and clear cost models. The best AIOps platforms also support compliance, role-based access, and scalability for growing data volumes.
4. Which AIOps platforms are best for enterprises vs. smaller IT teams?
Enterprises often benefit from AIOps platforms like Moogsoft, BigPanda, or IBM Instana that offer scalability and enterprise-grade integrations. Smaller IT teams may prefer tools like Dynatrace or Elastic AIOps, which deliver faster setup and more out-of-the-box automation.
5. How do I choose the right AIOps platform for my IT team?
Start by identifying your biggest pain points whether it’s alert fatigue, lack of observability, or slow incident response. Run a proof of concept with real data, check pricing models carefully, and evaluate integrations with your existing stack. Finally, consider vendor support and future roadmap before deciding.


Leave a Reply