

AI agents are harder to monitor than chatbots for one simple reason: there is much more happening between the user's request and the final answer.
A chatbot might receive a question, call an LLM, and return a response. An agent can interpret the task, retrieve information, choose a tool, call an API, inspect the result, decide what to do next, call another tool, and repeat the process before producing an answer.
That creates a different monitoring problem.
A request can finish successfully while the agent takes the wrong path. It can return a 200 OK after making unnecessary tool calls, spending far more tokens than expected, or quietly failing to complete the user's actual task. Traditional application monitoring can tell you that the request completed. It cannot always tell you whether the agent made a good decision along the way.
That is why AI agent monitoring needs more than uptime, latency, and error-rate dashboards. If you are comparing platforms for this layer, our guide to LLM observability tools covers the main capabilities to look for in production AI systems. You need to see the agent's actions, measure the efficiency and quality of those actions, and understand what happened when a run goes wrong.
Table of Contents
Why Agents Break Differently from Chatbots
The biggest mistake is treating an agent like a chatbot with a few extra API calls.
An agent is closer to a small software system making decisions inside a workflow. Its behavior depends on the model, available tools, instructions, retrieved context, application state, and the results returned by external systems.
For a broader look at how these components come together in business workflows, see our guide to building AI agents for scalable business operations.
Consider a customer-support agent.
A user asks for a refund. The agent reads the ticket, checks the customer's plan, retrieves the refund policy, calls a billing system, decides whether the request qualifies, and either prepares the refund or escalates the case.
A chatbot monitoring setup might tell you that the final response took 4 seconds and returned successfully.
Agent observability needs to answer different questions:
- Did the agent retrieve the right policy?
- Did it choose the correct billing tool?
- Did the tool return an error?
- Did the agent retry the same call?
- How many model and tool steps were required?
- Did a human have to correct the result?
- Did the agent actually complete the task?
The failure can happen several steps before the final response.
That is why agent monitoring needs to capture the execution path, not just the endpoint result. Current observability systems model agent runs as traces containing individual observations or spans for operations such as LLM calls, tool calls, and retrieval.
There is another difference worth keeping in mind: multi-agent systems add another layer of complexity.
One agent may delegate work to another agent, which calls tools of its own. If your telemetry only records the final response, you lose the relationship between those steps. The monitoring system needs enough structure to reconstruct which agent initiated the work, which agent or tool handled it, and where the final result came from.
The goal is not to record every internal thought an agent might generate. It is to capture the observable decisions, actions, inputs, outputs, timings, errors, and state transitions needed to understand its behavior.
The Six Metrics That Matter
There is no universal list of agent metrics. The right set depends on the task.
A research agent, customer-support agent, and coding agent will have different success criteria. Still, six categories give most teams a useful starting point.
1. Task completion rate
Start with the outcome.
Did the agent actually complete the task it was given?
For a support agent, that might mean resolving or correctly routing a ticket. For a research agent, it could mean producing a report that satisfies a defined set of requirements.
Task completion is more useful than simply tracking response success because an agent can generate a perfectly valid response without accomplishing the intended task.
Define the completion condition before you define the dashboard.
2. Tool-call success and error rate
Agents become operationally interesting when they can act through tools.
Track:
- successful tool calls
- failed tool calls
- timeout rate
- retry rate
- invalid arguments
- unavailable tools
- tool latency
This lets you separate an agent failure from an infrastructure failure.
OpenTelemetry's GenAI semantic conventions include attributes for tool names, call arguments, results, tool types, and agent or workflow operations, giving teams a structured way to represent this telemetry.
A 20-second agent run is not necessarily a model problem. One slow CRM API call could account for most of that time.
3. Steps per task
Count how much work the agent needs to complete a task.
You can track:
- total spans
- LLM calls
- tool calls
- retrieval operations
- retries
- handoffs between agents
The number alone does not tell you whether a run is good or bad. Some tasks naturally require more steps.
What matters is the distribution.
If a task normally takes five steps and suddenly starts taking 14, something changed. It could be a prompt change, model change, tool failure, poor retrieval, or an agent getting stuck in a loop.
This is one of the simplest ways to detect behavioral drift.
4. Latency
Measure latency at more than the request level.
Track:
- total task latency
- LLM latency
- tool latency
- retrieval latency
- time to first token where relevant
- time spent waiting between steps
A single average latency number hides too much.
An agent might have normal average latency while a small group of requests takes 10 times longer because of repeated tool calls. Break latency down by workflow, model, tool, agent, and task type.
Langfuse, for example, supports cost and latency analysis across users, sessions, features, models, and prompt versions.
5. Cost per task
Token usage is only one part of agent cost, but it is an important signal.
Track cost at the level where the business thinks about the work.
That could be:
cost per request → cost per task → cost per workflow → cost per customer
Then look at what caused the cost.
An expensive run might have used a larger model, made too many tool calls, retrieved excessive context, retried failed operations, or simply wandered through unnecessary steps.
OpenTelemetry's GenAI conventions include input and output token usage as well as cache-related token attributes, making token consumption available at the telemetry level.
6. Quality and human intervention
Technical metrics cannot tell you whether the agent's answer was useful.
You need at least one quality signal.
Depending on the application, that could be:
- task success
- evaluator score
- groundedness
- tool-use accuracy
- human approval rate
- human override rate
- escalation rate
- user feedback
For high-risk workflows, human intervention can be particularly revealing.
If an agent completes 90% of tasks but humans routinely rewrite its output, the headline completion number is hiding a quality problem.
The exact quality metric should come from the task. Do not create a generic "AI quality score" just because the dashboard needs one.
Trace Structure for Multi-Step Agents
Metrics tell you that something changed.
Traces help explain why.
A useful agent trace should represent one complete unit of work and preserve the relationship between the operations inside it. Langfuse's current data model, for example, groups individual observations into traces and traces into sessions, while representing LLM calls, tool calls, and retrieval as distinct observations.
A simplified agent trace might look like this:
Agent Run
│
├── LLM: Understand request
│
├── Retrieval: Find customer policy
│
├── LLM: Decide next action
│
├── Tool: get_customer_account
│   └── Result
│
├── Tool: check_refund_eligibility
│   └── Result
│
├── LLM: Prepare response
│
└── Final result
Now imagine the customer complains that the agent gave the wrong refund decision.
Without a trace, you may only see the final response.
With a structured trace, you can inspect the retrieval result, tool arguments, tool response, model call, timing, and final decision.
That changes debugging from "Why did the agent do this?" to "Which step produced the wrong input for the next step?"
What should a span contain?
A span represents an individual operation inside a trace.
For agent monitoring, useful spans can represent:
- LLM calls
- tool calls
- retrieval
- database operations where relevant
- agent handoffs
- workflow steps
- evaluation events
Each span should carry enough metadata to understand the operation.
For an LLM span, that might include the model, token usage, latency, and request identifiers.
For a tool span, it might include the tool name, execution status, duration, and sanitized arguments or result metadata.
OpenTelemetry's GenAI conventions define attributes for model information, token usage, tool calls, retrieval, agent operations, and workflow names. They also warn that prompts, outputs, and tool arguments can contain sensitive information, so telemetry collection needs appropriate filtering and access controls.
The structure matters as much as the data.
If every tool call appears as an unrelated event, you cannot easily tell which model decision triggered it. A good trace preserves parent-child relationships so the execution tree reflects the workflow.
Langfuse's tracing guidance specifically recommends nesting tool calls under the agent or span that orchestrates the step rather than leaving them disconnected at the trace root.
Detecting Loops, Tool Failures and Cost Blowups
The most useful monitoring system does not just tell you that an agent failed. It helps identify the pattern.
Runaway loops
A loop often looks like this:
Agent → Tool A → Error
          → Tool A → Error
          → Tool A → Error
          → Tool A → Error
The final request may eventually time out.
But you should not wait for the timeout.
Set limits around:
- maximum steps
- maximum tool calls
- repeated calls to the same tool
- maximum retries
- maximum execution time
- maximum estimated cost
A repeated tool call is especially interesting when the tool keeps returning the same failure.
For example, if an agent calls get_invoice six times with identical arguments, the problem is probably not "high traffic." The agent is failing to interpret or recover from the tool response.
Tool failures
Not every tool failure should trigger the same alert.
A temporary timeout may deserve a retry. An invalid argument may indicate a model or schema problem. A permission error could indicate a deployment or access-control issue.
Record the failure type separately.
That makes your alerts more actionable.
Cost blowups
A sudden increase in cost per task can come from several places:
Model change → larger token usage → more expensive runs
or:
Tool failure → retries → more model calls → higher cost
or:
Prompt/context growth → larger input → higher token consumption
The trace should let you follow the chain.
A cost dashboard without trace-level context can tell you that spending increased. It cannot necessarily tell you why.
Quality regressions
Some failures are invisible to technical monitoring.
An agent can stay within its latency budget, use the expected number of tokens, and return no errors while becoming less accurate.
That is where evaluation belongs alongside observability.
Current agent-evaluation workflows increasingly use production traces as inputs to evaluation, allowing teams to identify failures in real traffic and turn recurring problems into regression cases.
The practical loop looks like this:
Production trace → identify failure → create test case → evaluate fix → deploy → monitor again
That is more useful than treating monitoring and evaluation as completely separate systems.
Putting Options Together
You do not need a huge observability stack on day one.
Start with the smallest system that gives you enough information to answer three questions:
- What did the agent do?
- Why did it do it?
- Did the task succeed?
For a new agent, the initial setup can be:
Agent runtime → instrumentation → trace collector/backend → dashboards and alerts
Then add evaluation:
Agent runtime → traces → evaluation → regression dataset
And eventually connect the two:
Production traces → failure detection → evaluation dataset → CI/CD checks → production
OpenTelemetry is useful as an interoperability layer because its GenAI conventions provide structured attributes for agents, tools, models, retrieval, tokens, and workflows.
The tooling choice depends on your environment.
A platform such as Langfuse emphasizes application tracing, metrics, dashboards, cost and latency analysis, and evaluation around traces.
Phoenix focuses on tracing and evaluation for AI applications, while Braintrust connects agent traces with evaluation and production monitoring workflows.
The important point is not which vendor has the longest feature list.
It is whether your monitoring system can follow the agent's actual execution and help your team move from failure → diagnosis → fix → verification.
On-Call
Agent monitoring becomes much more useful when the person receiving an alert can do something with it.
A generic alert such as:
"Agent error rate increased."
is not enough.
A useful alert might say:
"Refund agent task-completion rate dropped 12% in the last 30 minutes. Most failed runs contain repeated
check_refund_eligibilitycalls."
That gives the on-call engineer somewhere to start.
Good alerts should include enough context to answer:
- Which agent is affected?
- Which workflow?
- Which version?
- Which model?
- Which tool?
- How large is the change?
- When did it start?
- Is cost increasing?
- Can the affected traces be inspected?
Keep alerts tied to actionable thresholds.
For example:
High priority
- task completion drops below the accepted threshold
- repeated tool failures affect a critical workflow
- execution cost exceeds a defined limit
- agent step count crosses a hard safety boundary
Lower priority
- gradual latency increase
- small changes in token consumption
- unusual but non-critical tool usage
Do not alert on every unusual trace.
Agents are probabilistic systems. If every unusual behavior becomes an incident, the team will eventually ignore the monitoring system.
The goal of on-call monitoring is not to report everything an agent does. It is to surface behavior that requires investigation.
Reference Architecture
A practical production architecture can be built in layers:
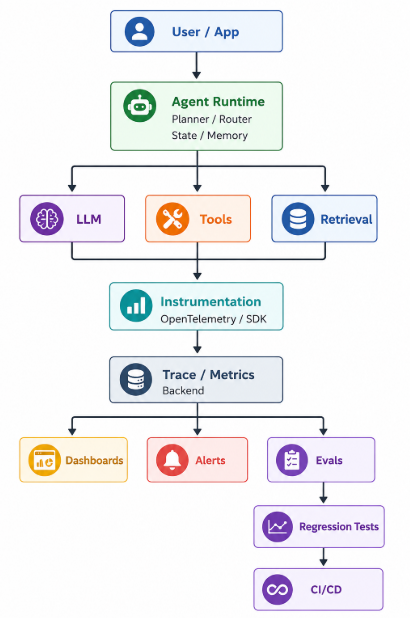
The key is that the telemetry layer sits across the agent workflow rather than only around the final API response.
Your trace should connect the model call to the tool call, the tool call to its result, and the result to the next decision. That gives engineers a causal path through the workflow.
From there, metrics can aggregate the traces, alerts can detect important changes, and evaluation can determine whether the behavior is actually good.
FAQs
How do you monitor an AI agent?
Monitor both the agent's execution and its outcome. Capture structured traces for LLM calls, tool calls, retrieval, agent handoffs, and important workflow steps. Then track task completion, tool failures, execution steps, latency, cost, and quality signals.
What metrics matter for agents?
Start with task completion rate, tool-call success rate, steps per task, latency, cost per task, and quality or human-intervention metrics. The exact definitions should reflect what successful completion means for your specific agent.
How do you catch runaway agent costs?
Track cost at the task and workflow level, then connect expensive runs to their traces. Set limits for maximum steps, retries, tool calls, execution time, and estimated cost. Sudden increases in token usage or repeated tool calls can reveal the source of a cost spike.
What is span-level tracing?
Span-level tracing breaks one agent run into individual operations, such as an LLM call, retrieval step, tool call, or workflow action. Those spans are connected within a trace so engineers can see the order and relationship between operations. This makes it easier to identify the step responsible for a failure.
Final Takeaway
Monitoring an AI agent is not about putting another dashboard in front of your engineering team.
It is about making the agent's behavior inspectable.
A healthy production agent should give you enough telemetry to answer four questions:
Did it complete the task?
What path did it take?
How much did that path cost?
Can we explain and reproduce the failure when something goes wrong?
That requires more than request counts and error rates.
Start with structured traces. Capture tool calls, model calls, latency, tokens, failures, and task outcomes. Add limits for loops, retries, execution time, and cost. Then connect production traces to evaluations so recurring failures become tests rather than recurring incidents.
The best monitoring setup is not the one that records the most data.
It is the one that lets an engineer move from "something went wrong" to "we know which step failed, why it failed, and how to stop it happening again."


